|
Table of Contents
Accessing and Displaying Protein InformationAccessing Protein Information
function [ptn] = ptn_get(ptn, optionname, optionvalue, ...)
 an interface to read/extract/calculate various properties (e.g., atoms,
  CA-atoms) of a protein. keeps track of caching, so properties are not
  calculated each time.

default options:
 chain: -
 range: []
 which: 'protein,info,atoms,caCoords'
 recache: 0
 dbg: 0
A subset of the following list of information can be requested by comma-separating in the value of pdb, protein, info, atoms, caCoords, criticalPoints, atomsWithin_cp, atomsWithin_cp, atomCounts_cp, atomCenterOfMass_cp, cp_cas, writhe_cp, numPieces_cp, features_cp, features_cp_normalized, fasta
For example, let's get information about pdb >> ptn = ptn_get('1irda')
ptn =
pdb: '1irda'
protein: [1x1 struct]
info: [1x1 struct]
atoms: [1x1069 struct]
caCoords: [141x3 double]
The description of each of the protein information fields is given in the table below. Some of the fields are intended as intermediate processing steps, and are cached for fast processing.
Here is an example of getting caCoords and criticalPoints of >> ptn=ptn_get('1irda','which','caCoords,criticalPoints')
ptn =
pdb: '1irda'
caCoords: [141x3 double]
criticalPoints: [209x7 double]
Displaying Proteins and Critical Points
function draw_backbone(coords, varargin)
 draws the protein backbone in 3D
 coords can be pdb file name, a protein struct, or a list of coords.

default options:
 simple:    1 %simple stick figure, or
 LineWidth: 1 %backbone thickness
 useSphere: 0 %use spheres for c-alpha atoms?
 sphereRadius: .4
 sphereDetails: 6 %number of polygons to use
 cylinderDetail: 8 %number of polygons to use
 color: [.2 .2 .2] %drawing color
 withLabels:  0 %show sequence numbers?
 labelShift:  0.3 %shift the label from center
 R:  [] %rotation matrix, helpful when drawing aligned structures
 T:  [] %translation matrix
 lighting: 'gouraud'
 shading: 'interp'
 colormap: 'gray'
 renderer: 'OpenGL'
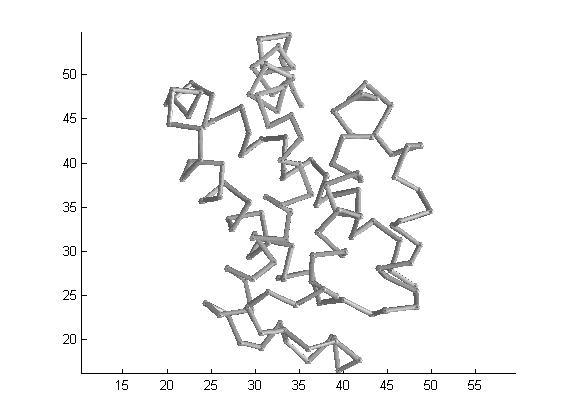
As an example, let's draw protein >> draw_backbone('1irda','simple',0,'useSphere',1,'colormap','bone');
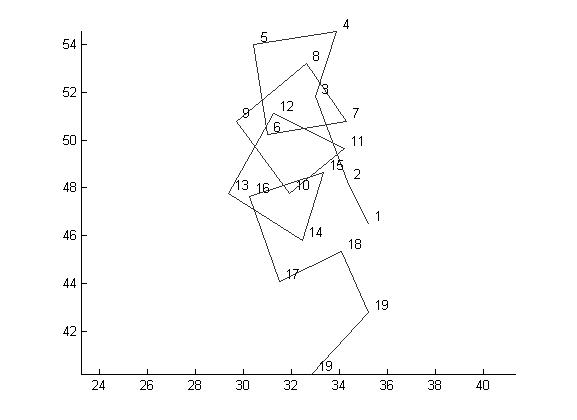
You can drag&move the mouse pointer to rotate the protein, or use the Matlab's figure toolbar for zoom and other figure options. Let's draw again, only a section of the backbone, using the protein struct from >> ptn=ptn_get('1irda','which','caCoords,criticalPoints')
ptn =
pdb: '1irda'
caCoords: [141x3 double]
criticalPoints: [209x7 double]
>> draw_backbone(ptn.caCoords(1:40, :),'simple',1,'withLabels',1);
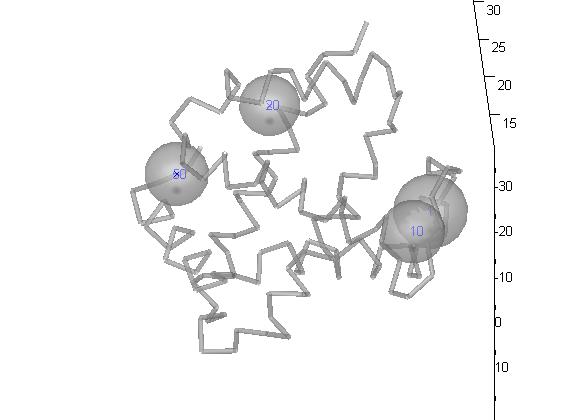
Now, we can use function handles=draw_cps(centers, varargin) draws critical points. use this together with draw_backbone. default options: large: 0 shift: 0.3 withSpheres: 1 R: [] T: [] labelStart: 1 labels: [] withDetails: 0 withCenter: 1 withLabel: 1 sphereDetails: 16 color: b tetra: [] caCoords: [] and now, let's draw some critical points of irda: >> draw_backbone(ptn,'simple',0); >> draw_centers(ptn.criticalPoints([1 10 20 50], :), 'labels',[1 10 20 50]);
|


