Following this link may get you blocked.

Mining Globins Family

Setting up the experiment dataset

  • We need to specify proteins that are in the Globins family and also provide with a list of background proteins to use. Here, we utilize the dataset used in a related study (Z. Aung and K.-L. Tan. Rapid 3d protein structure database searching using information retrieval techniques. Bioinformatics, 20:1045–1052, 2004.).
  • The dataset contained 200 proteins selected from representative ASTRAL database with less than 40% sequence homology. Out of these 200 proteins, 20 were randomly selected from two distinct families: 10 proteins from Globins family (a.1.1.2 in SCOP) and 10 proteins from Serine/Threonine Kinases family (d.144.1.1 in SCOP). The remaining 180 proteins were randomly selected from four major SCOP classes of the same representative ASTRAL database. Note that the 3D structures stored in ASTRAL are not actually whole proteins, but they are domains within the proteins according to SCOP domain definitions.
  • The list of pdbs for each of these families are then listed in a file under LFMPro/Parameters with the following format:
#shortFamilyName long-family-description
pdb1 pdb2 ...

where pdb1, pdb2 are pdb names with chain identifiers (as for example, given in SCOP). You can download the globins and kinases dataset file as it was prepared by Aung, et.al., 2004 and place it into the Parameters folder.

Pre-processing the experiment dataset

  • Now, open Matlab, chdir into LFMPro/src directory, and initialize LFMPro by:
>> globals_set();
  • Use data_prepare_experiment function to preprocess the pdbs listed in our experiment file:
>> [ptns,fams]=data_prepare_experiment('experimentFile','families.globins.kinases.txt')
  1- 10 a.1.1.2 - (Globins)
 11- 28 a.1.1.* - (Globin-like)
 29- 38 d.144.1.7 - (Ser/Thr Kinases)
 39-227 _except_a.1.1.* - (except Globins)
228-424 _except_d.144.1.7 - (except Ser/Thr Kinases)

ptns = 
1x278 struct array with fields:
    pdb
    features_cp_normalized

fams = 
1x5 struct array with fields:
    name
    title
    ind
    members
    range
    numMembers
 

For each family, data_pdbs_cleanup function will be called, which checks to make sure that the member pdb files are present in the LFMPro/Data/Pdb folder, and then tries to load the pdb to ensure that it meets length and gaps criteria if any are provided in the options. If there are missing pdb files, the script will exit, prompting you to place the missing files in the data folder. If you have zipped pdb files, but not the text versions, you will be provided with shell commands/script to untar and copy these files to the LFMPro/Data/Pdb folder.

Mining for significant sites

After ensuring that all pdb files are present, the data_prepare_experiment function will generate the critical points along with the associated features for each of the pdbs. Upon completion of preprocessing, the function will return the list of proteins and families read from the specified experiment file. The indices and range of the family proteins will be useful in specifying which proteins to use in training or testing. Using these family definitions, we can now start mining process:

>> rep=mine_family_represent('globins', 'ptns',ptns([1:10]), 'rand',ptns([39:227]),'recache',1)

rep = 
        feats: [1296x14 double]
       scores: [1296x1 double]
     borderDs: [1296x1 double]
    threshold: 0.2560

Here, we gave globin-like proteins (1 through 10) as the family to be mined, and the rest of the proteins in the dataset as the outgroup. The return value of mine_family_represent is a struct that includes the representation of the family, and the threshold value is the lowest membership score for a member of the family.

Examining and displaying the sites

The returning value feats is the feature vectors generated, and scores is the corresponding discriminative scores of these features. Now we can use these features and map them on to one of the proteins:

>> signatures_show('1irda', 'familyName','globins', 'numHits',1, 'pretty',1);
 1: 1  -->208. score=0.000 dist=0.035 count=1
  residues:  PHE43 HIS58 HIS87 TYR42 PHE46 LEU91 LEU29 HIS45 VAL62 LEU86 PHE33 LEU83 VAL93
  atoms:  PHE43(N,CB,CG,CD1,CA,CE1,CZ,CD2,CE2) HIS58(CB,CG,ND1,CD2,CE1,NE2,O,CA) HIS87(CA,CB,CG,ND1,CD2,CE1,NE2) TYR42(CB,CG,CA,CD1,C,O) PHE46(CE1,CZ,CD1,CE2) LEU91(CB,CG,CD1,CD2) LEU29(CD1,CD2) HIS45(CE1,NE2) VAL62(CB,CG2) LEU86(CG,CD2) PHE33(CZ) LEU83(CD1) VAL93(CG2)
drawing the protein...
drawing the local sites found...

globins:1irda - top scoring site
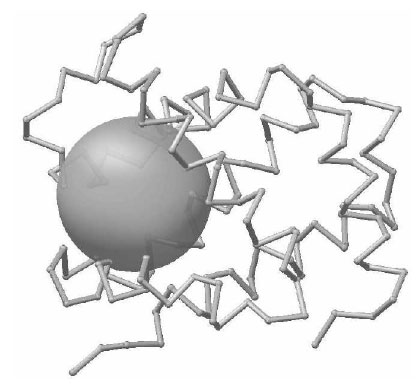
Figure. mapping of top scoring representative features of Globins family onto protein 1irda.

In the Matlab window, you can use click&drag the mouse to rotate the protein. To turn on the labelling of the residues, pass the parameters 'label',1.

The figure above shows the top representative critical point with its spherical neighborhood, perfectly allocated at the heme-binding pocket of the protein 1irdA – human hemoglogin alpha subunit. This metal binding pocket is highly conserved in the Globins family and its presence is critical for the function of the protein. The Histidine residues 58 and 87 responsible for binding Iron atom are contained within this spatial neighborhood. The residues within the representative site are given in the output, along with the detailed atom list.

It is also possible to see the rest of the features mapped on to the protein space (use numFeats parameter in signatures_show function. The function signatures_show matches the submitted features to the features generated from the given protein by minimizing the distances between them, which may cause more than one representative feature to map onto same feature of the protein. The count value shows the number of such representative features. To make the mapping unique, you can pass doSimilarOnesFilter option as 1 in mine_sites function.